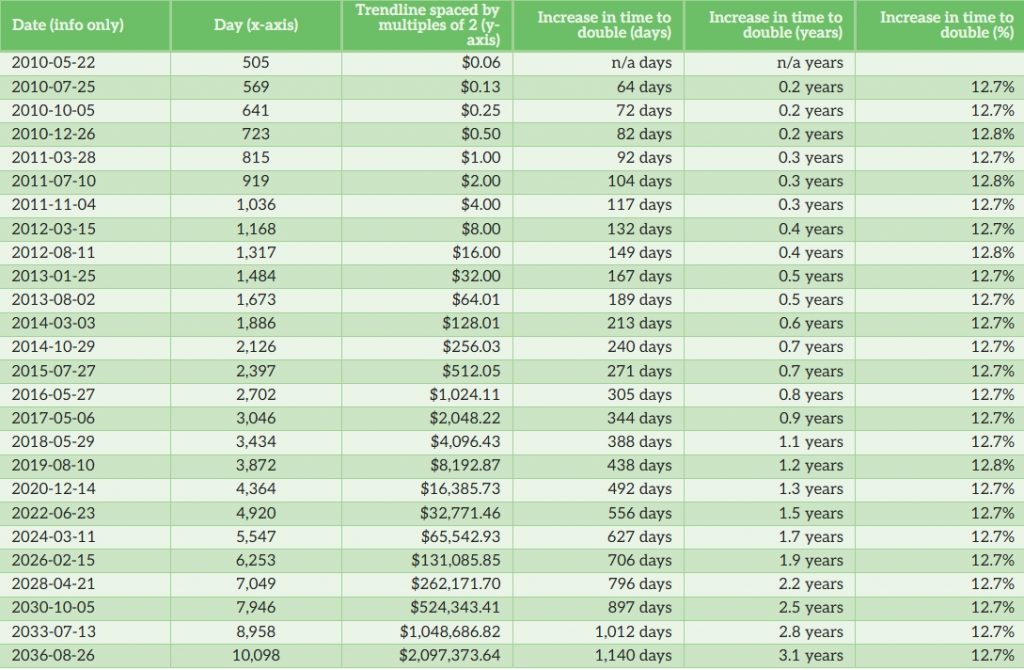
The following table shows how the Bitcoin price-time relationship manifests itself in a proportionate way. Each row in the table shows how long it takes for the trendline to double. If we then measure the increase in days that is reflected in each row, we find a proportional increase in time…see the Last column.
Stated another way: For every ~13% increase in days in the life of Bitcoin, the price (adoption) of the trend doubles. It doesn’t matter where we start the increment. This is how the power curves work, and a great illustration of how a network grows.
Source: The chart – Porkopolis Economics
Leave a Reply